ABOUT
Embarking on my professional journey, I graduated college not quite sure of my destination. Little did I know, this uncertainty was a blessing in disguise, leading me to discover my true passion: building software. If you're seeking someone who turned a quest for purpose into a love for coding, you've found your match.
Designed and developed python based microservices at MUFG, for an automated business intelligence data platform. The result? Delivering data visualization insights that paved the way for informed decision-making.
Currently, I am actively exploring new horizons. As I navigate this phase, I am not only open to new job opportunities, but also deeply engaged in creating and contributing towards innovative software development projects.
EXPERIENCE
MAY 2022 — SEP 2023
Software Engineer VP • MUFG
Designed and developed microservices for an automated business intelligence data platform utilizing Python, PostgreSQL, Docker and Openshift.
-
Python
-
FastAPI
-
PostgreSQL
-
SQLAlchemy
-
Docker
-
Openshift
JULY 2019 — MAY 2022
Software Engineer AVP • MUFG
Owned and executed data visualization products end to end from backend microservices development to the creation of data visualizations implemented in Tableau and Power BI.
-
Python
-
PostgreSQL
-
Docker
-
Openshift
-
Tableau
-
PowerBI
PROJECTS
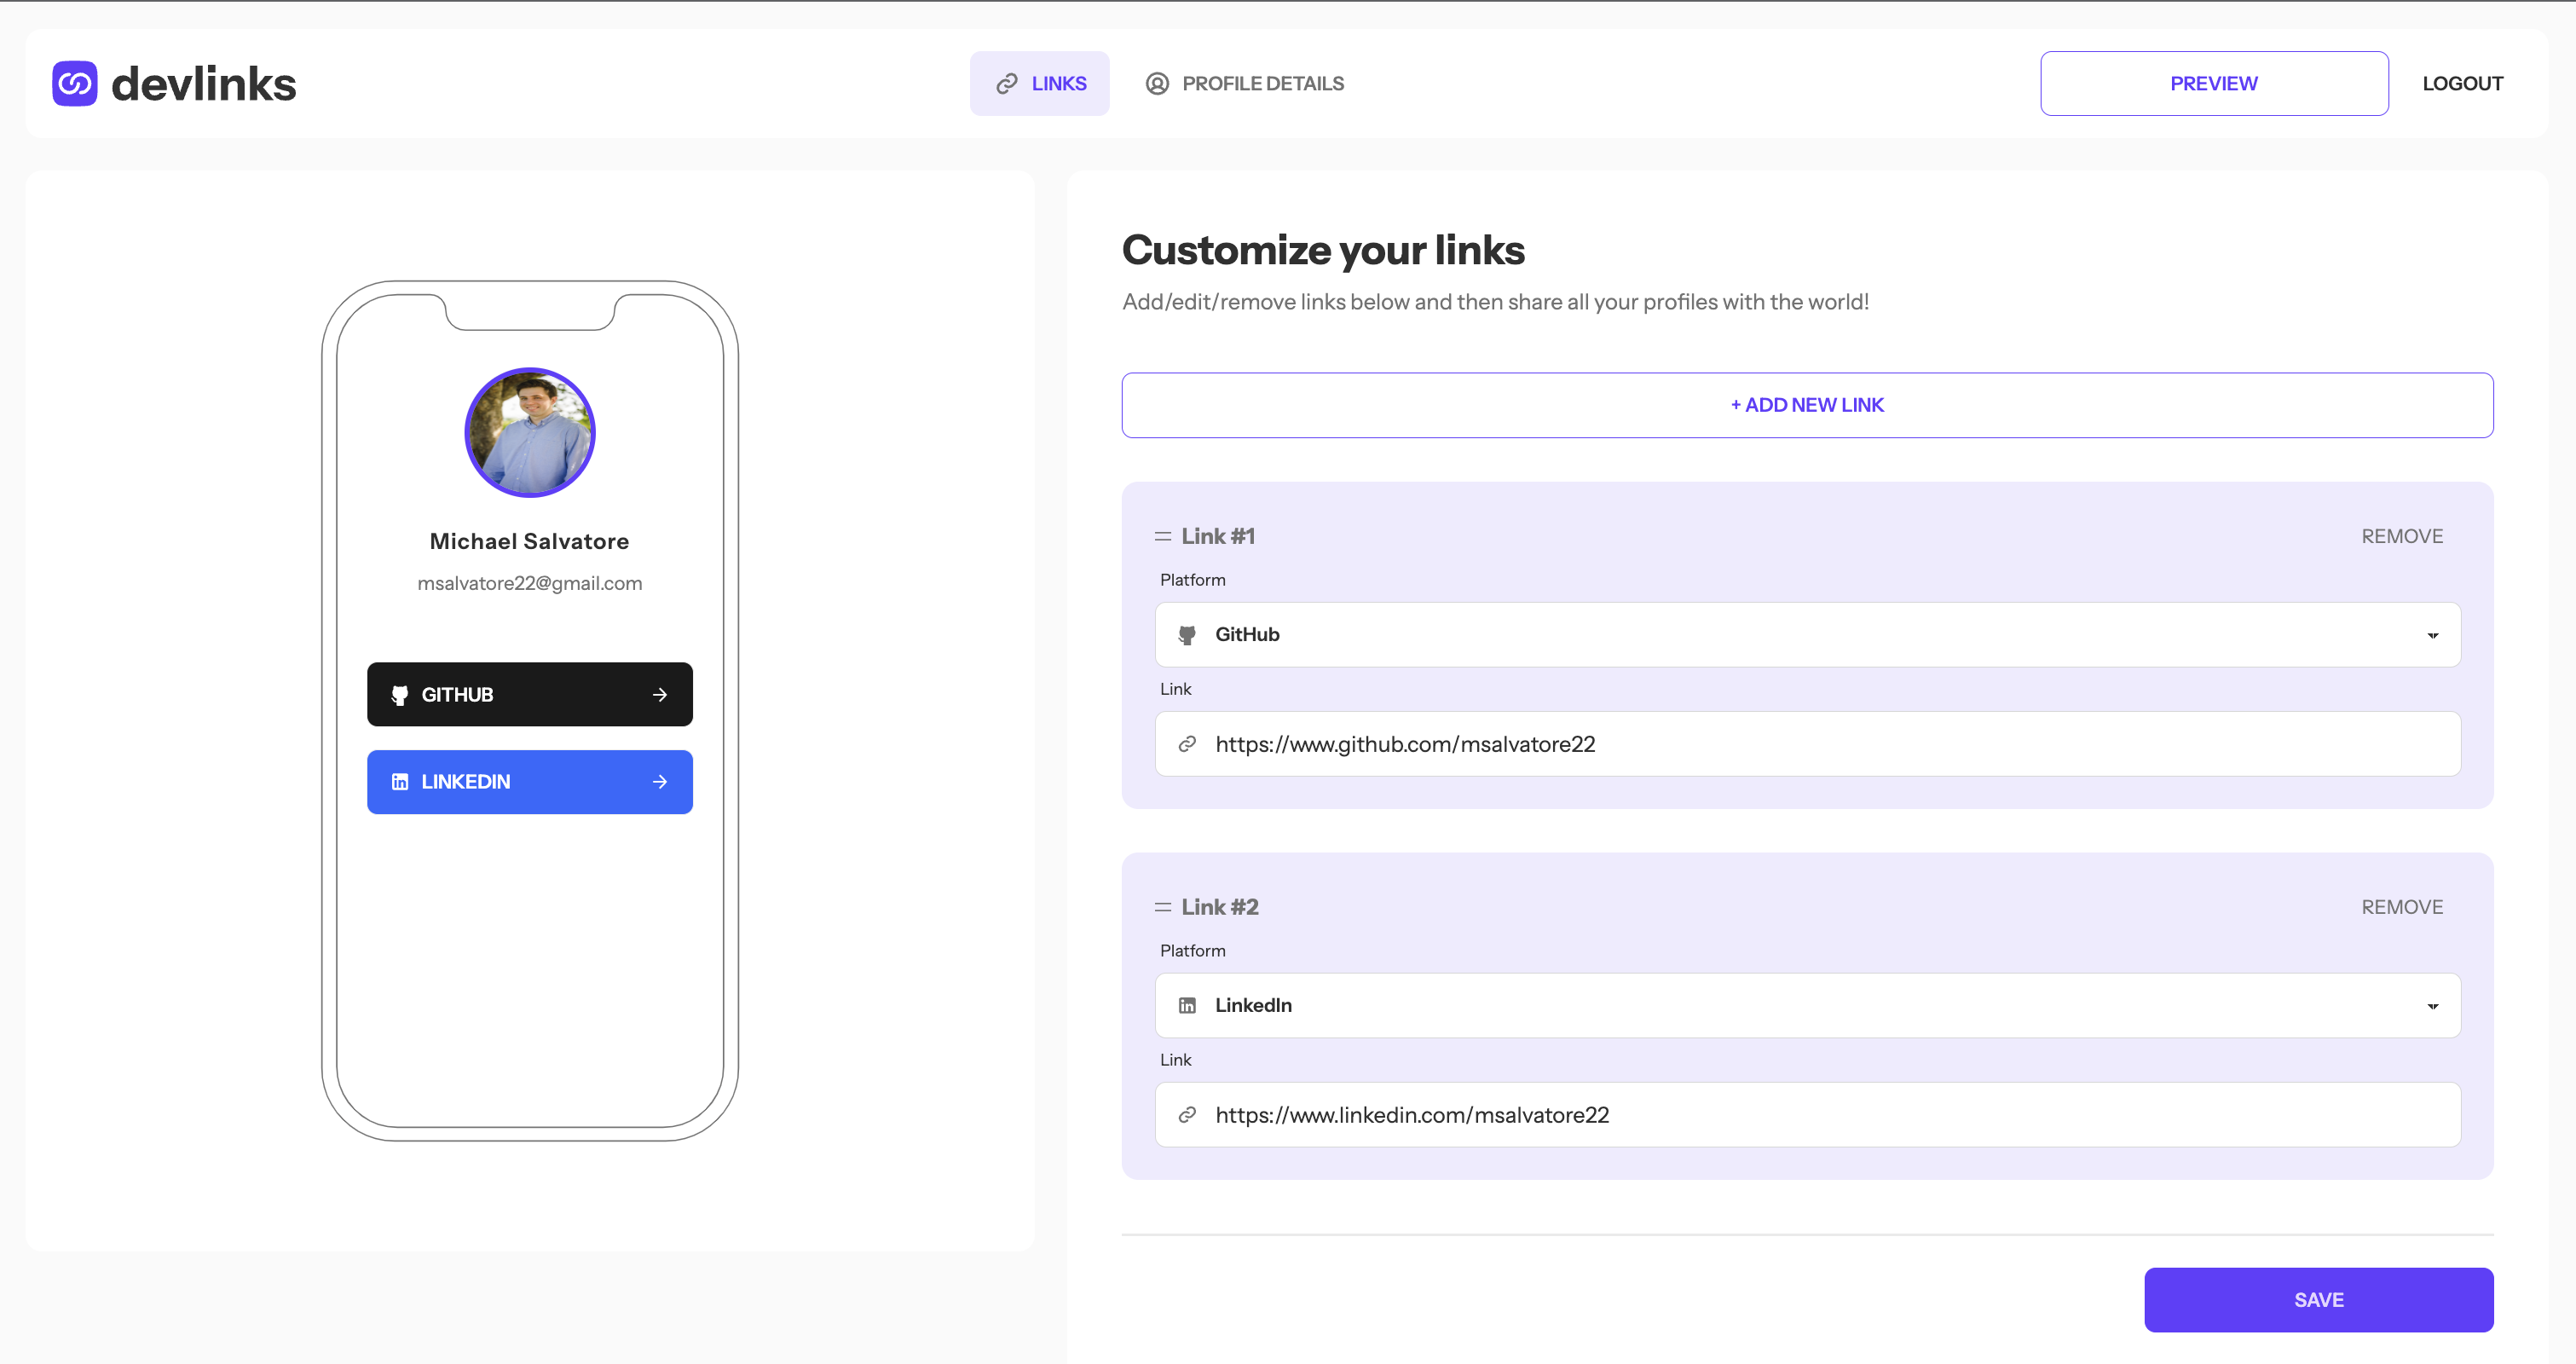
Devlinks
Single page application for creating and sharing relevant links to others as a software developer. Frontend built with React & Typescript with Firebase as backend. Responsive design implemented with Tailwind & Daisy UI, React DnD, React-Toastify.
-
Typescript
-
React
-
Firebase
-
Tailwind
-
Daisy UI
-
Vercel

Pro Football Metrics
Webscraping application to display NFL metrics. Built with Django, PostgreSQL, Celery for scheduled webscraping tasks and Redis as a message broker. Responsive design implemented with Bootstrap and charting implemented with Chart.js.
-
Django
-
PostgreSQL
-
Celery
-
Redis
-
Bootstrap
-
Chart.js
-
Render.com


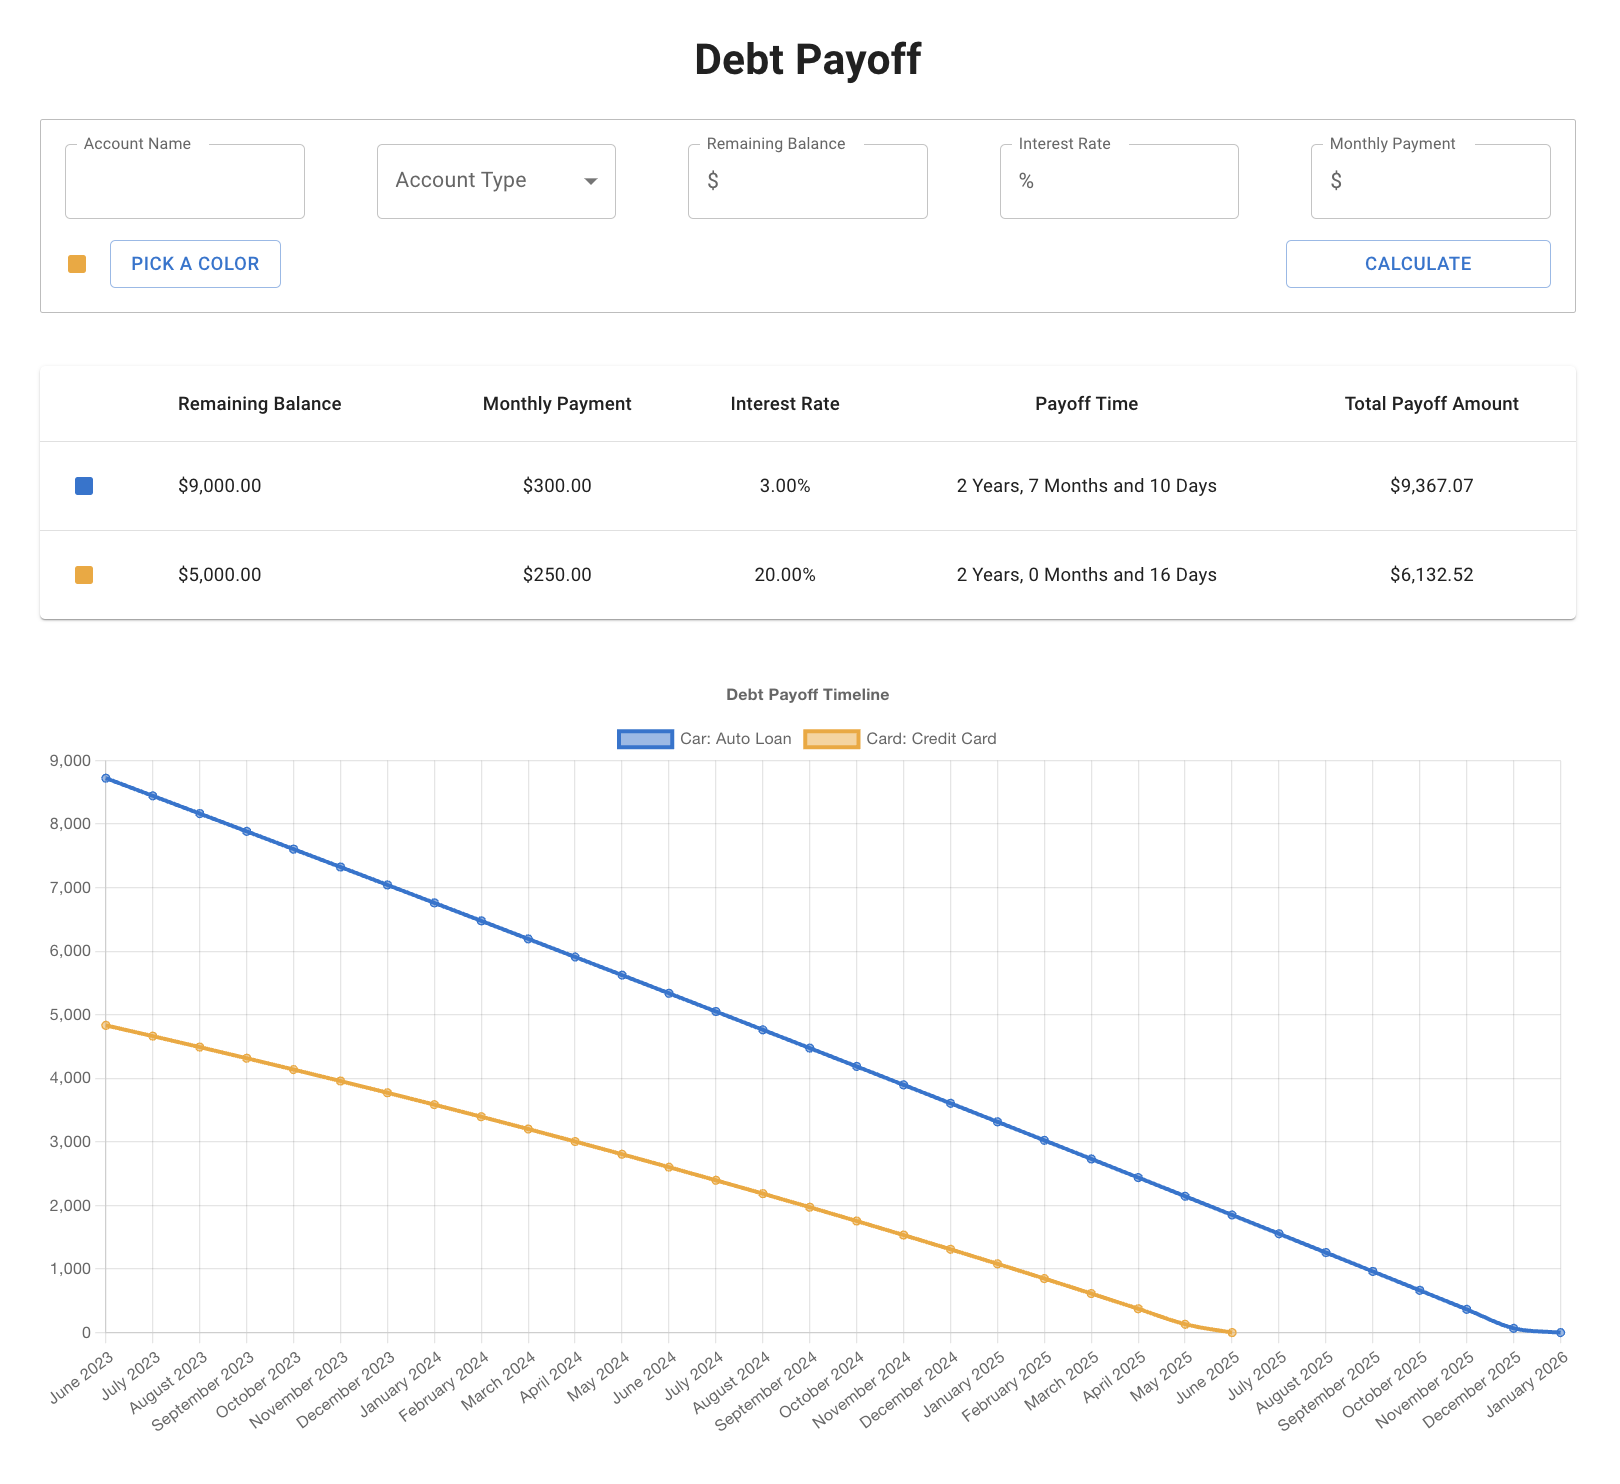
Debt Calculator
React component used calculate and visualize the time to pay off debts. Enter debt information into form and see the results rendered in a table and burn down chart. Responsive design implemented Material UI and charting with Chart.js
-
React
-
Material UI
-
Chart.js
-
Github Pages
Michael Salvatore 2023
Built using HTML, Sass and JavaScript
